Weather Observations near Celina (2:14 pm)
Weather Forecast for the Grand Lake area
Wind direction arrow points in direction wind is
blowing toward. Example: wind is blowing
from southwest to northeast.
Wednesday
May 20
| avg high: |
73.2°F |
| avg low: |
52.5°F |
| rec. high: |
92, 1975 |
| rec. low: |
36, 2015 |
| Sunrise: |
6:15 am |
| Sunset: |
8:54 pm |
| Moonrise: |
8:50 am |
| Moonset: |
n/a |
Thursday
May 21
| avg high: |
73.5°F |
| avg low: |
52.9°F |
| rec. high: |
91, 1975 |
| rec. low: |
38, 1967 |
| Sunrise: |
6:14 am |
| Sunset: |
8:55 pm |
| Moonrise: |
10:07 am |
| Moonset: |
12:22 am |
Friday
May 22
| avg high: |
73.8°F |
| avg low: |
53.2°F |
| rec. high: |
97, 1988 |
| rec. low: |
37, 2006 |
| Sunrise: |
6:13 am |
| Sunset: |
8:56 pm |
| Moonrise: |
11:22 am |
| Moonset: |
12:56 am |
Saturday
May 23
| avg high: |
74.0°F |
| avg low: |
53.6°F |
| rec. high: |
89, 1964 |
| rec. low: |
31, 1963 |
| Sunrise: |
6:13 am |
| Sunset: |
8:56 pm |
| Moonrise: |
12:32 pm |
| Moonset: |
1:24 am |
| First Quarter Moon: |
7:11 am |
Sunday
May 24
| avg high: |
74.3°F |
| avg low: |
53.9°F |
| rec. high: |
89, 1977 |
| rec. low: |
35, 2025 |
| Sunrise: |
6:12 am |
| Sunset: |
8:57 pm |
| Moonrise: |
1:39 pm |
| Moonset: |
1:47 am |
Monday
May 25
| avg high: |
74.6°F |
| avg low: |
54.3°F |
| rec. high: |
91, 2012 |
| rec. low: |
38, 1992 |
| Sunrise: |
6:11 am |
| Sunset: |
8:58 pm |
| Moonrise: |
2:42 pm |
| Moonset: |
2:08 am |
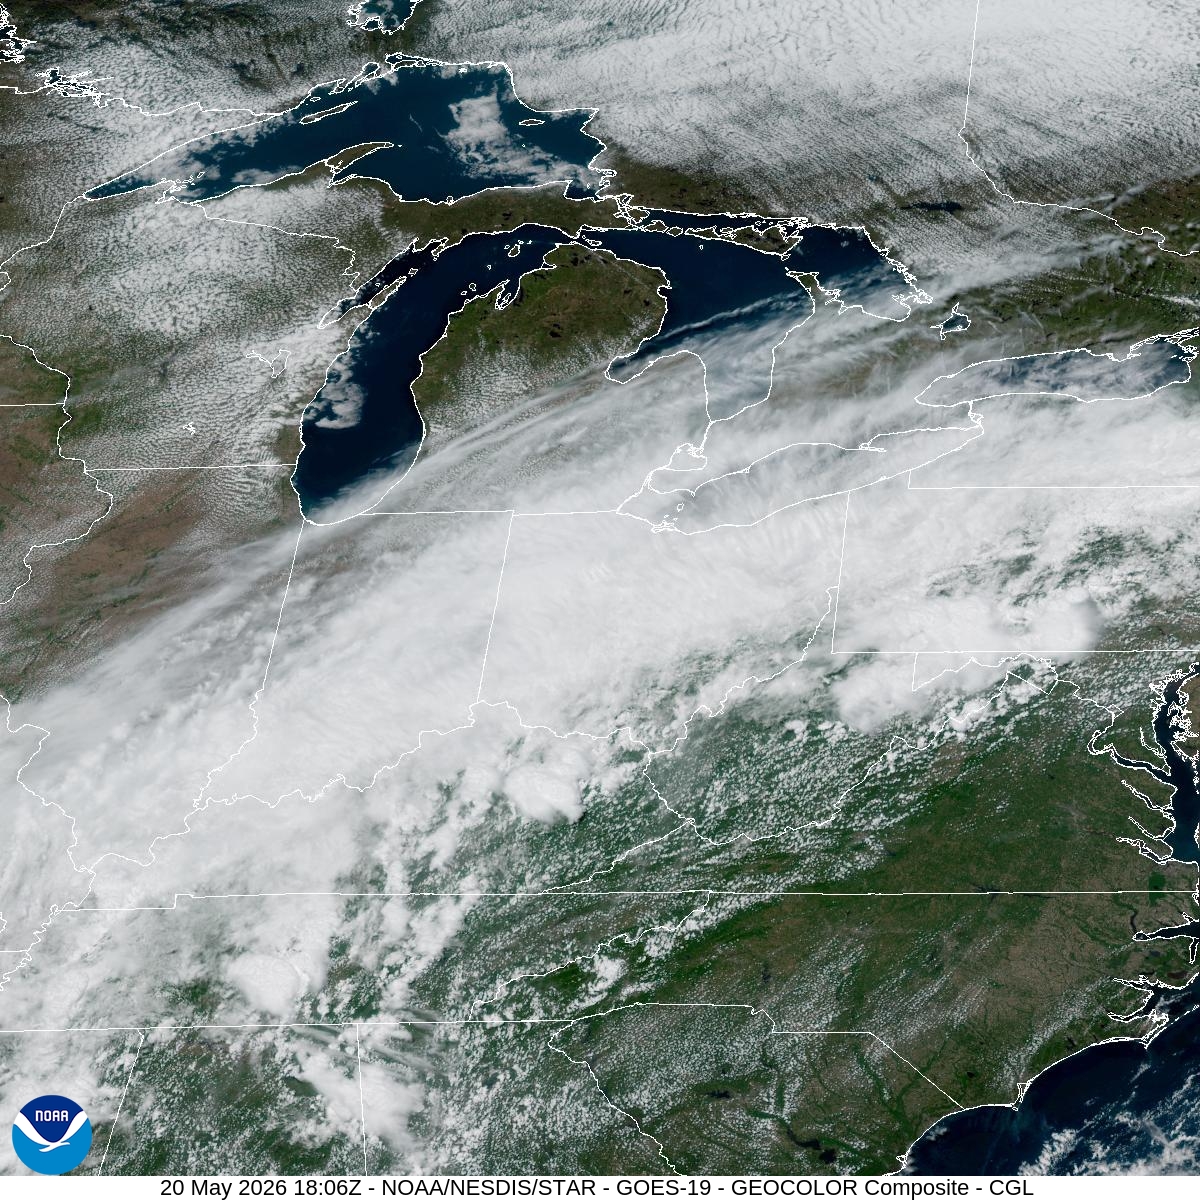
Midwest US from Satellite
2:06 pm, May 20
(Tap or click to animate.)
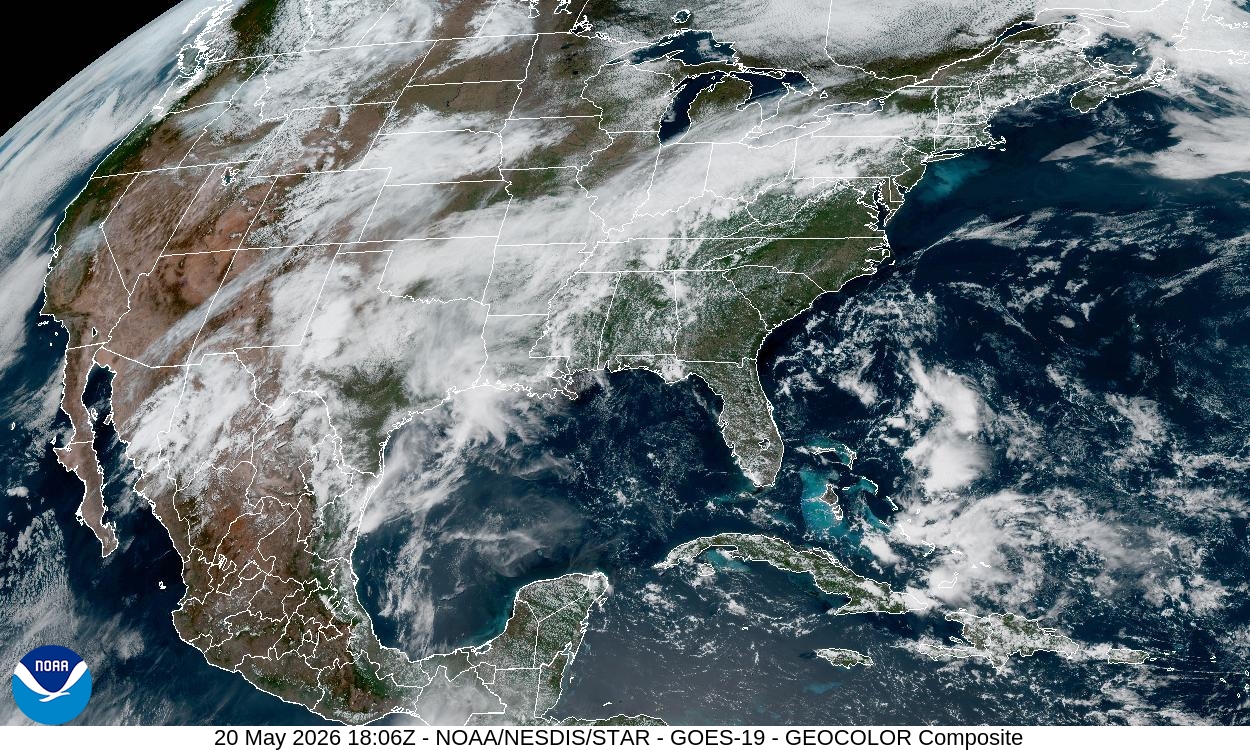
Contiguous US from Satellite
2:06 pm, May 20
(Tap or click to animate.)
US Weather Map
12:31 pm, May 20
(Tap or click to animate.)
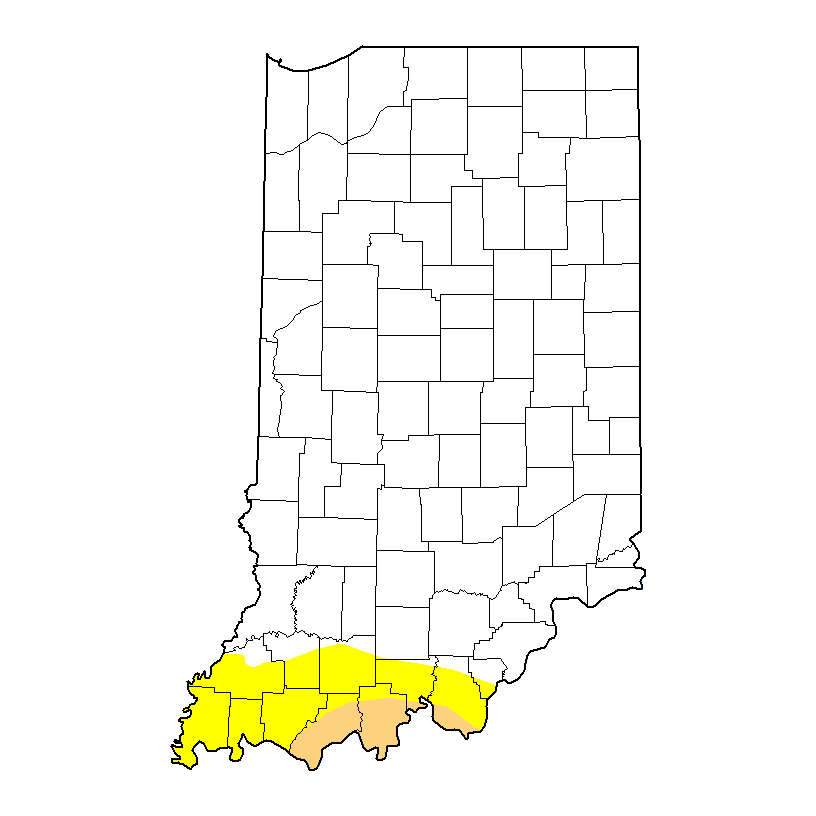
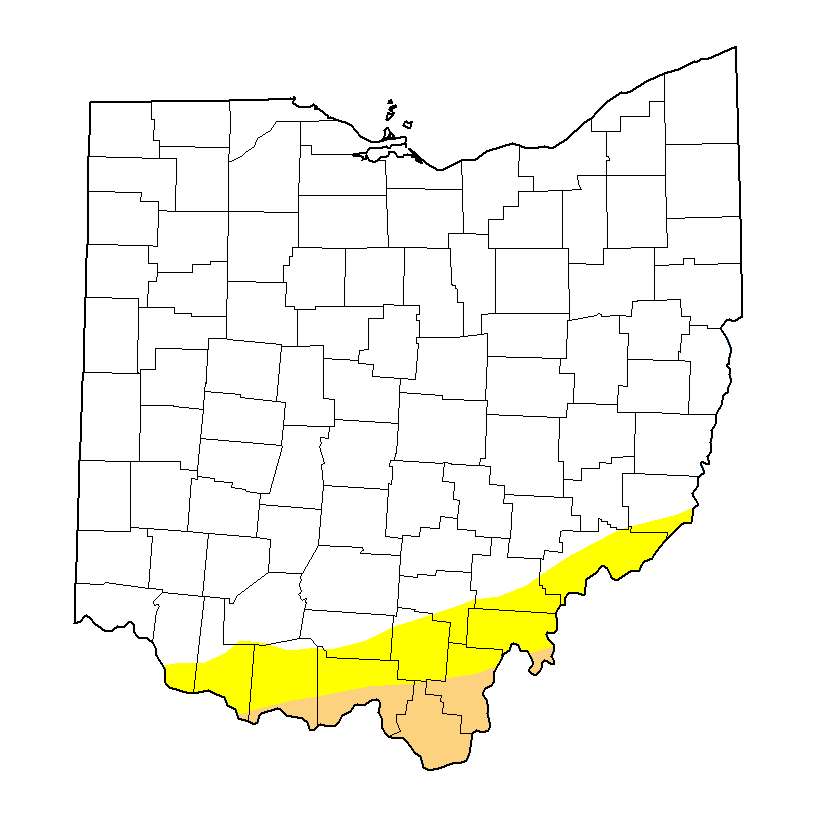
Drought Maps
May 12, 2026
(Tap or click to animate.)
Copyright © 2026 Standard Printing Co. All Rights Reserved